| Fractal Imaging |
|---|
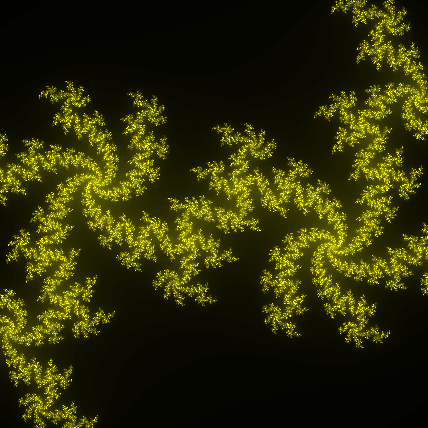
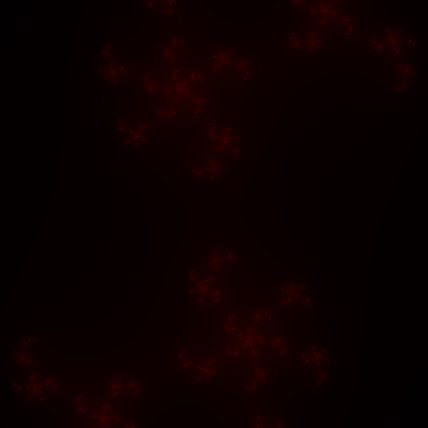
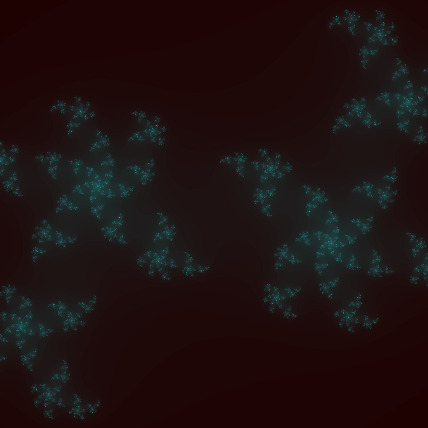
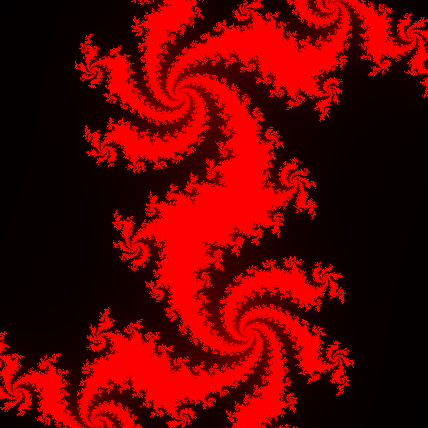
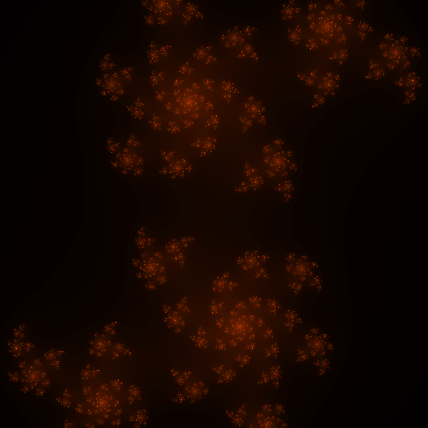
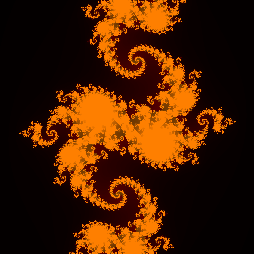
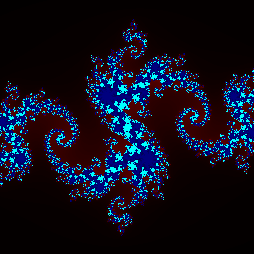
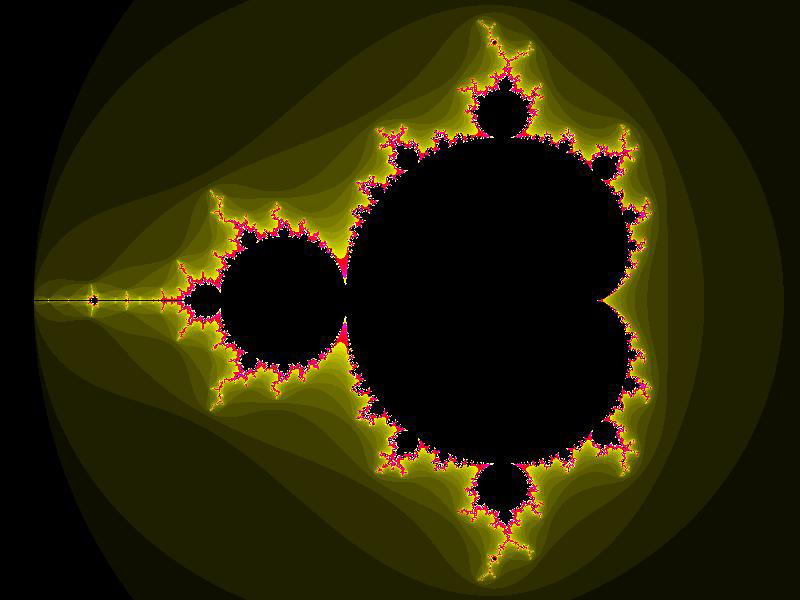
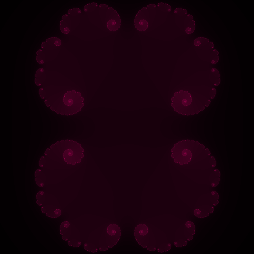
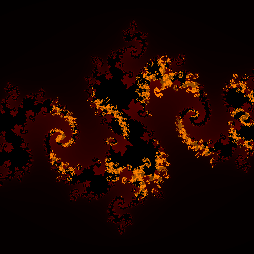
| The following images were written using a 20 line piece of code. Written in Python, I used the PIL (Python Imaging Library) to draw graphic representations of Julia and Mandelbrot Sets. These are iterations of polynomials and rational functions. Drawn with an RGB color scale, the x-axis represents the plotted real numbers, and the y-axis represents the imaginary set. For both the Julia and Mandelbrot sets, they are based on a simple recursive equation: Z = Z^2 + C. For the Mandelbrot set, C is a constant, real number. For the Julia set, K is a fixed, complex number. |

|
|
|
|
|
|
|

|
|
|
|
|
Copyright © 2009 David Straily

